Managed an annual paid media budget of over 500 million VND for B2B audiences, driving sustainable lead growth through funnel-based allocation, weekly optimization, and a focus on lead quality rather than impressions.
Challenge
Ad budget was spread across many platforms without clear allocation rules. Cost per Lead kept rising while quality did not improve.
Objective
Standardize the operating process by aligning budgets with each funnel stage and assigning one core metric to each campaign group.
Execution
Segmented target audiences by readiness, aligned content, creative, and media efforts across funnel stages, and maintained a weekly optimization cycle.
Results after 9 months
Key results
Rather than just counting the campaigns run, I focused on the metrics that showed how the Performance system created value.
500M+
VND in paid media budget managed annually
4.000+
Leads recorded
400+
Qualified B2B Leads handed to Sales
62%
Leads from decision-makers
Performance overview
From Jan 2026 to Jun 2026
Campaign performance overview
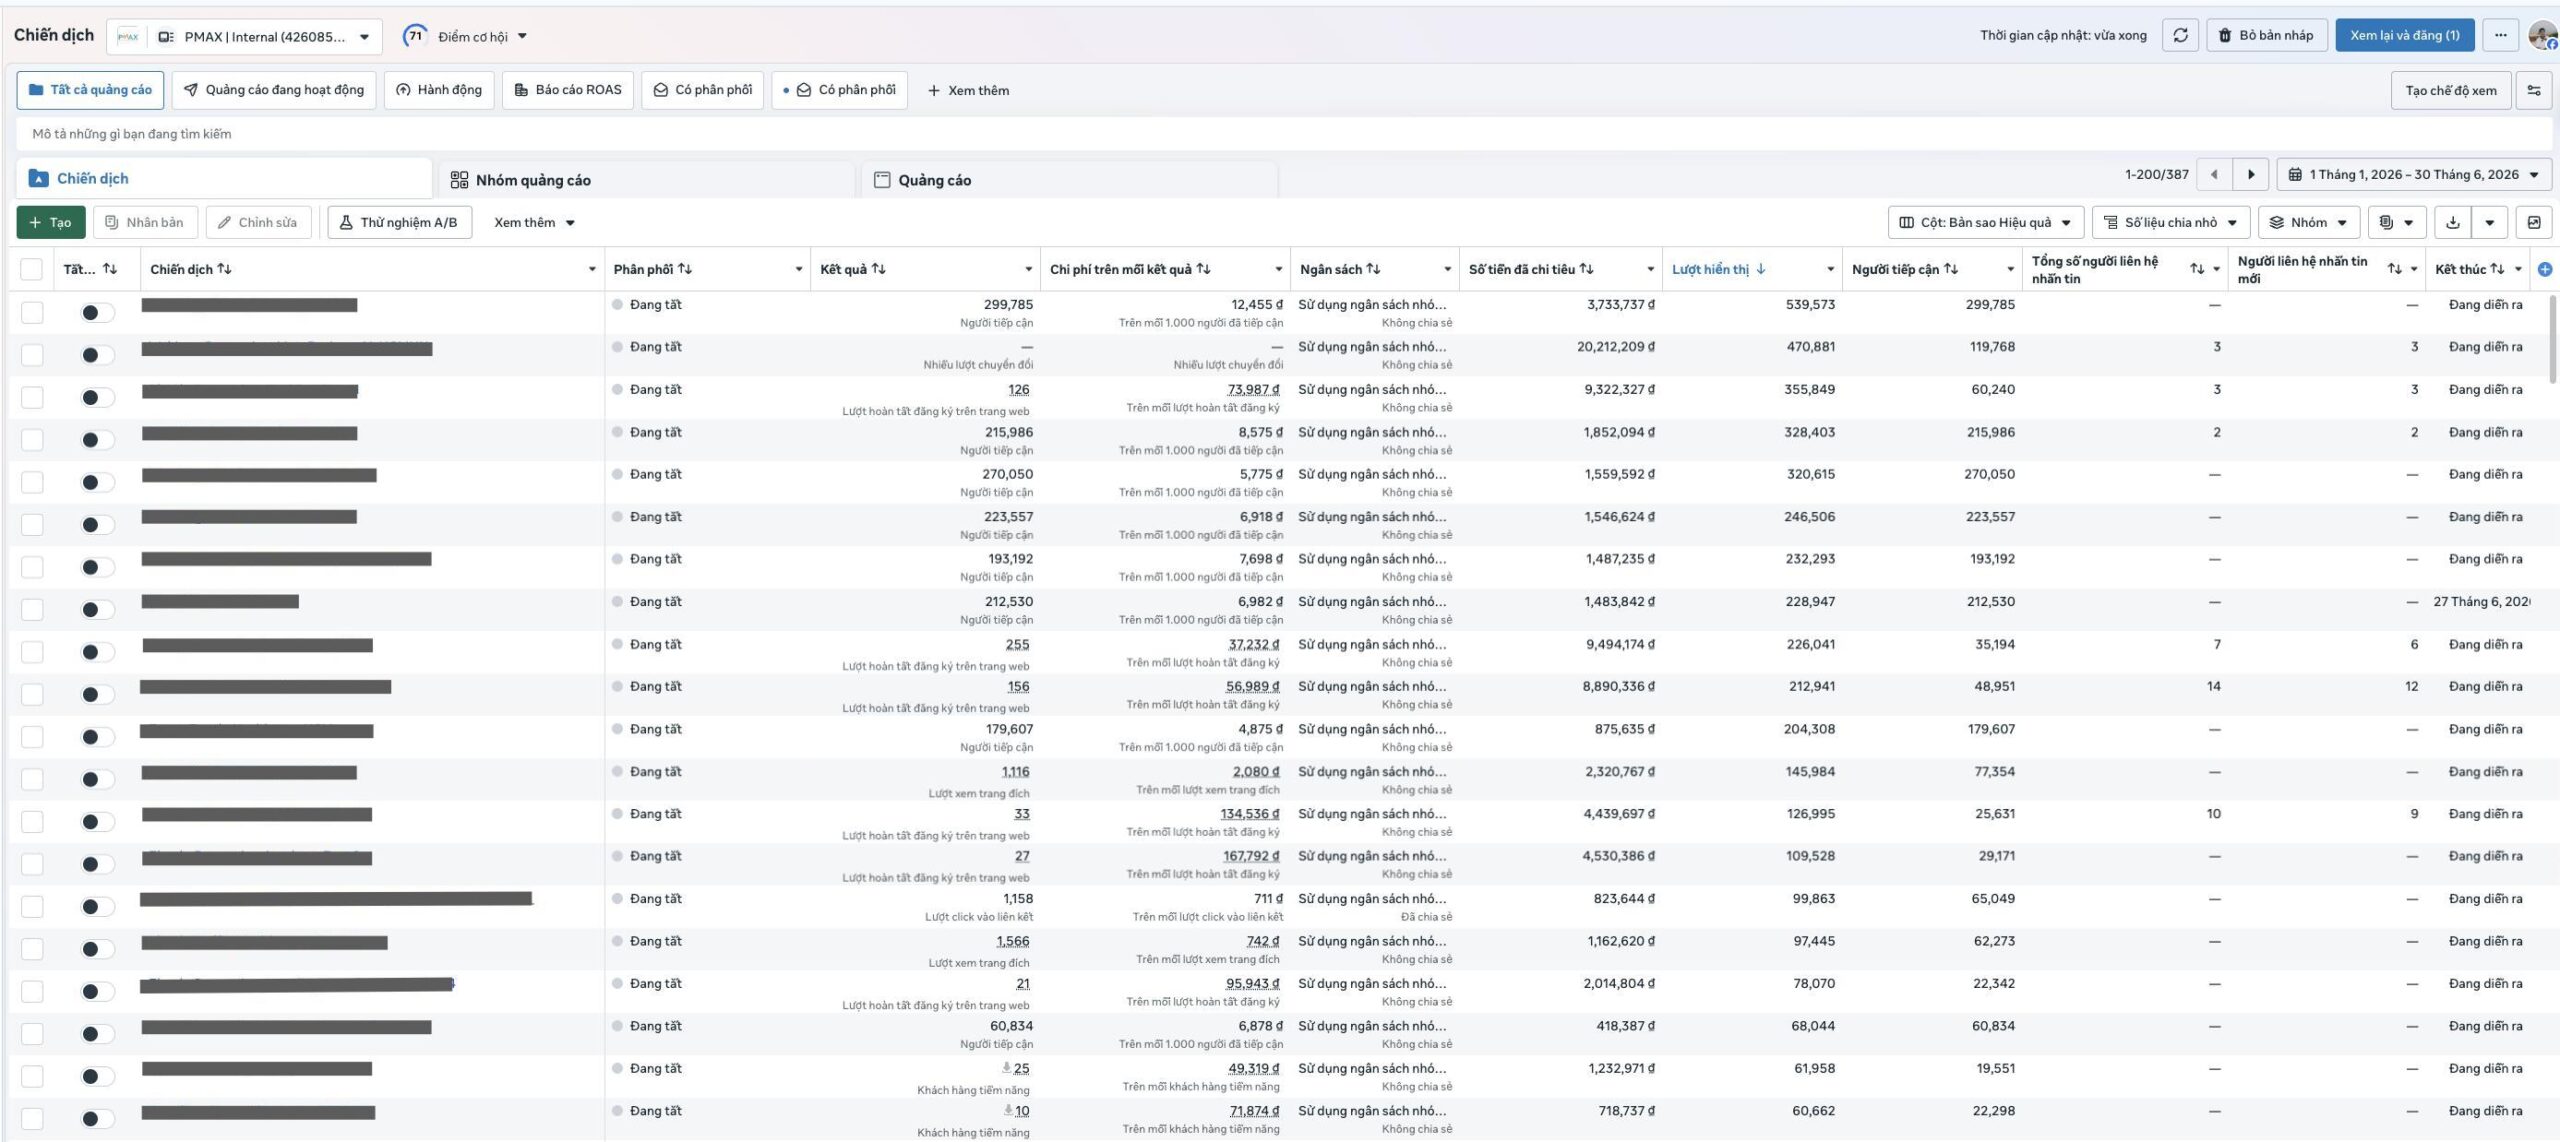
Every strategy is validated by data. Below are the Paid Media figures for the six-month period, extracted from the original reports.
5,486,720
Impression
2,741,386
Clicks
12,260
Link Clicks
6.15%
Conversion Rate (CR)
108,040 VND
Cost Per Lead (CPL)
Source data
(Facebook Ads Manager)
Per-campaign performance from Jan 2026 to Jun 2026 (click the image to enlarge)
Optimization focus
01
Budget allocation
Focusing on the groups with the strongest performance and most efficient costs.
02
Audience strategy
Segmenting by interest level and actual behavior.
03
Campaign structure
Setting up campaigns aligned with each funnel stage.
04
Creative optimization
Testing many different messages and angles.
05
Lead quality
Managing performance by qualified Lead rate rather than CPL.
Budget allocation
Budget allocation by strategy, not equal split
I retain final decision-making authority over the budget. Spending is allocated according to each funnel stage's role and actual cost efficiency, rather than the platform's default recommendations.
Budget under direct management
500M+ VNDPer year
4 campaign groups
3 collaborating teams
Reviewed every 2 weeks
Lead Generation 38%Event Registration 30%Brand Awareness 20%Retargeting 12%
Sample allocation: Jan 2026 - Jun 2026
Source: Facebook Ads Manager
01
Budget follows the funnel stage
The conversion tier receives the largest share to support business KPIs, while upper-funnel tiers receive enough budget to maintain a steady flow of audience data.
02
Reallocation every two weeks
Campaigns with the lowest cost per Lead (CPL) and the highest qualified Lead rates are prioritized for additional budget.
03
Caps for scale-limited groups
Retargeting and CRM lists can be cost-efficient but are limited in size. Spending caps help prevent ad fatigue, while the remaining budget is redirected toward expanding new audiences.
Audience
Tiering audiences by readiness
The closer an audience gets to a purchase decision, the more specific the messaging needs to be. Each of the four audience tiers below serves a distinct objective and is managed in parallel with the others.
01 - Lookalike Audience
Expanding from the best-converting customer lists to find users with similar profiles and behavior.
02 - Interest & Behavior
Targeting B2B decision-makers based on industry-related behavior, specialized interests, and relevant audience characteristics.
03 - Remarketing Audience
Re-engaging users who have interacted with the website or Facebook Page, or watched videos, but have not submitted a lead form.
04 - Customer List
Nurturing and leveraging existing customer lists, with priority given to customers who have potential for contract expansion through upselling or cross-selling.
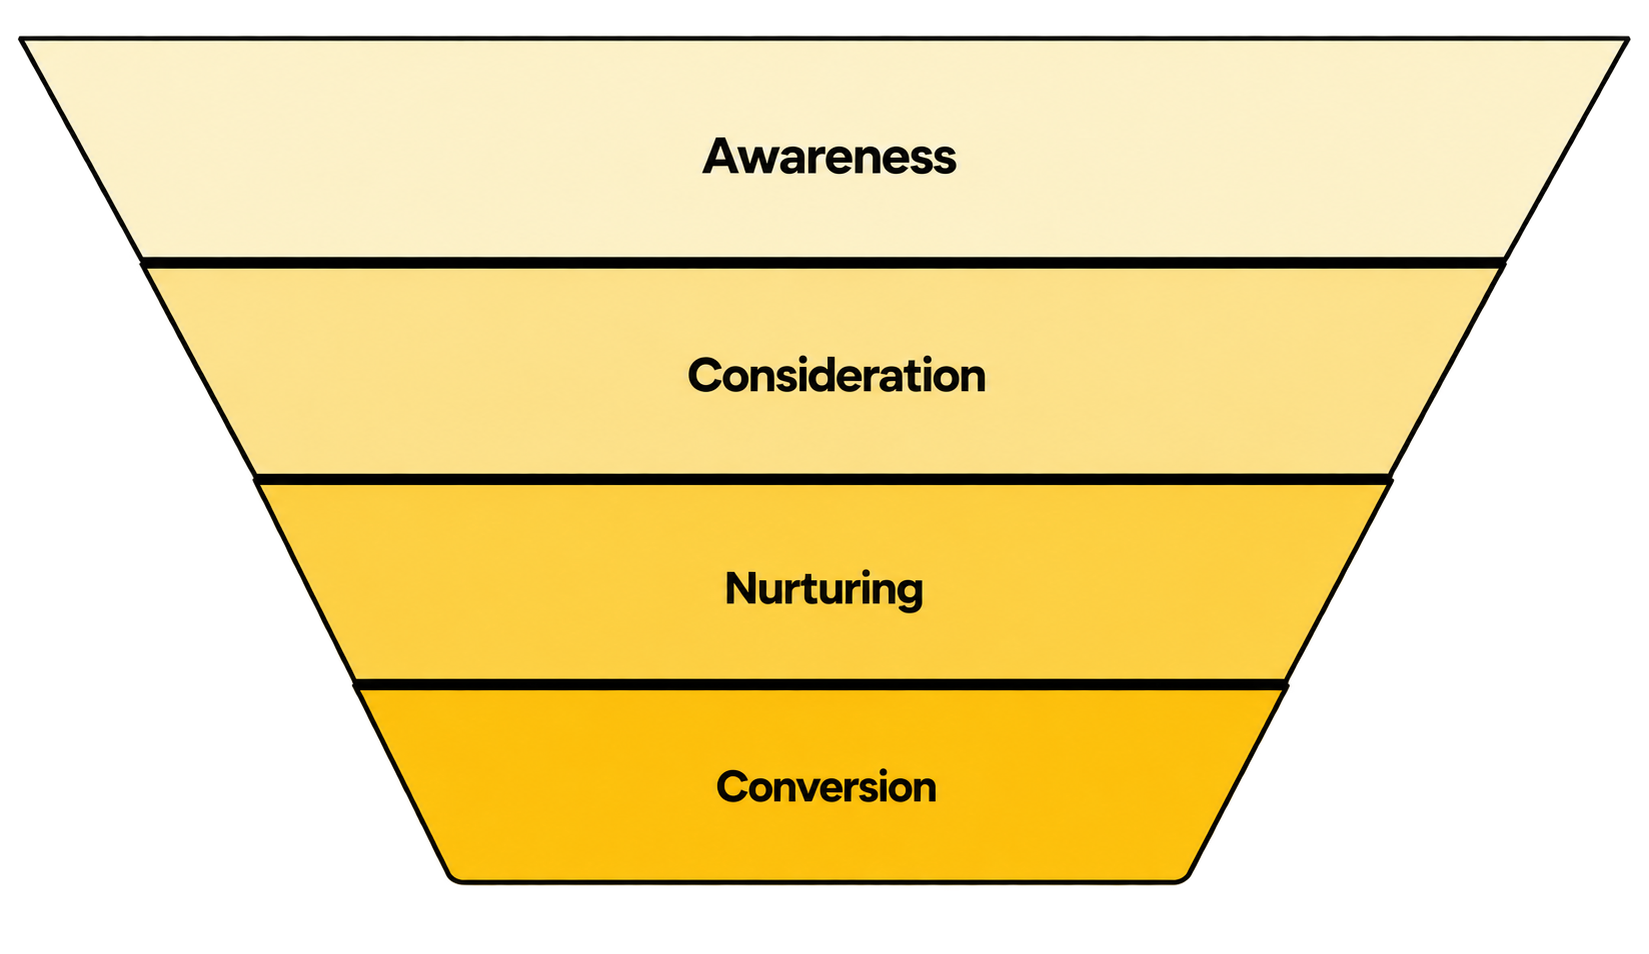
Width represents audience size, while color intensity indicates conversion readiness. Further down the funnel, audiences become smaller, but the budget per person increases.
Creative
Three top-performing ads
The most effective ads did more than attract clicks; they addressed the key pain points of decision-makers. The three ads stood out for both CTR and cost per Lead, so they were retained for further testing and scaling.
01
Healthcare and Beauty Industry Marketing Event
Going straight at in-depth solutions for each industry, hitting the operational pain points of businesses.
CTR
1.79%
Cost / Lead
37,243 VND
02
Ebook Brand Transformation 2026
Emphasizing results and practical value, pre-qualifying the audience from the very first message.
CTR
1.08%
Cost / Lead
64,442 VND
03
Vietnam Marketing Forum Event
Positioning an exclusive ticketed event, attracting a network of C-Level leaders and industry experts.
CTR
1.44%
Cost / Lead
420,847 VND
The system behind it
Three models behind every decision above
The budget allocation, audience segmentation, and creative selection above are data-driven decisions. They follow a standardized system built around the three core models below.
01
Full Funnel Media Strategy
Budget is allocated across 4 clear funnel tiers, each accountable for exactly one target metric:
Expanding reach
Measured by Reach and CPM.
Driving first engagement
Measured by CTR and CPC.
Nurturing audiences not yet ready to convert
Time-sequenced remarketing, measured by return rate.
Generating qualified leads
Measured by CPL and qualified B2B Lead rate.
Allocation rule
Each funnel tier is accountable for exactly one metric. Campaigns that fail to meet their KPIs have their budgets reduced, with no budget transfers between tiers to compensate for underperformance.
02
Creative Testing Model
Creative performance is evaluated using data rather than intuition. Each ad is scored against five standardized criteria, with specific recommendations for improvement.
Ad being scored
Expanding Auto market share in 2026 with LeadMax & LeadScan
An example of how the scoring framework is used
7.8/10
Total score
Tone & Mood
★★★★★★★★☆☆8/10
Feedback Bold colors reflect the automotive industry's character and convey a sense of growth.
Suggestion Tone down the motion effects so the visual feels cleaner and more focused.
Text on banner
★★★★★★★☆☆☆7/10
Feedback The headline stands out, but several layers of information compete for attention.
Suggestion Shorten the message and add more white space.
Content
★★★★★★★★☆☆8/10
Feedback The ad clearly presents the solution and desired action, aligning with the lead generation objective.
Suggestion Clearly explain the problems LeadMax & LeadScan solve for automotive businesses.
Design Elements
★★★★★★★★☆☆8/10
Feedback The vehicle imagery, colors, and typography create a distinctive look in the social media feed.
Suggestion Reduce the moving details in the background for more breathing room.
Call to Action
★★★★★★★★☆☆8/10
Feedback Short, direct, easy to understand.
Suggestion Test a CTA tied to a benefit or offer.
Where these criteria come from
01
Data collection
Gathering ad data from many different sources.
02
Analysis
Breaking down performance across dimensions (headline, CTA, content, and visuals).
03
Modeling
Using correlation models to identify the factors with the biggest impact.
04
Generating insights
Compiling insights to guide the next round of content production.
Output
A data-driven creative library that shows when to scale, revise, or pause an ad, replacing subjective judgments with measurable criteria.
03
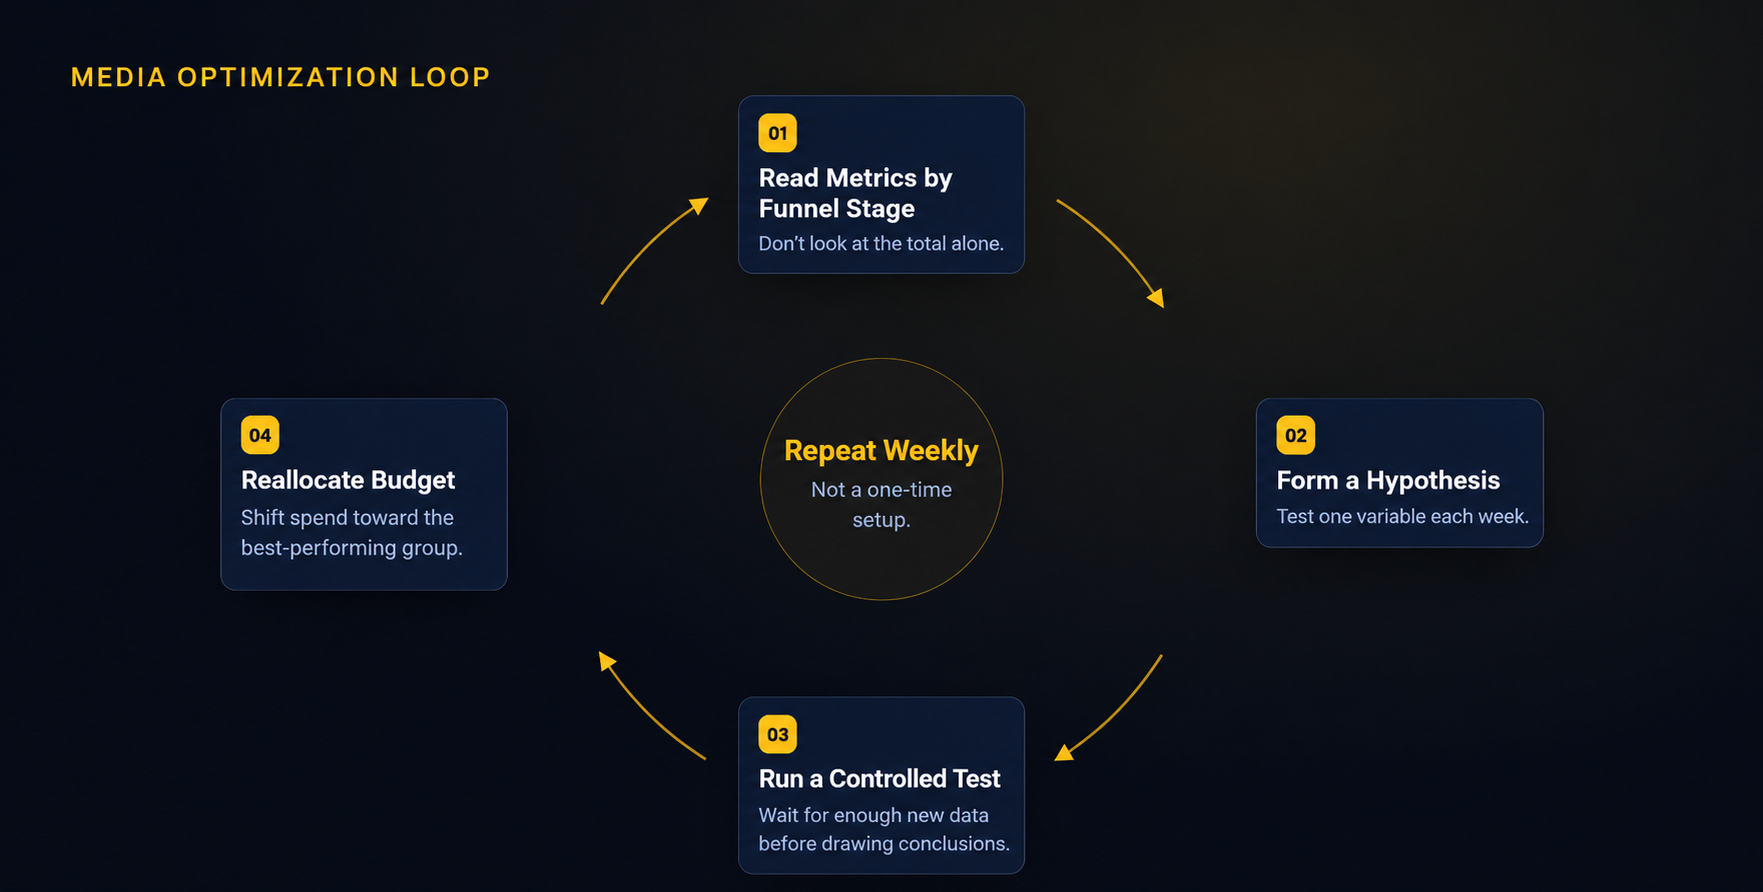
Media Optimization Loop
A weekly four-step optimization loop: analyze performance by funnel stage, form hypotheses, run controlled tests, and reallocate budget to the highest-performing areas.
Measurement and optimization
Accurate measurement to optimize every budget dollar
I integrated and synchronized data from multiple systems (ads, websites and landing pages, and CRM) to provide transparent reporting across the entire customer conversion journey.
Optimization goals
Comprehensive data optimization across the lead conversion journey
01
Full-funnel measurement
Integrating data across channels to build full-funnel reports and provide transparent tracking of the entire customer journey.
02
Marketing Mix Modeling
Measuring the interplay between channels and accurately assessing real value instead of only looking at the last touchpoint.
03
Strengthening data signals
Improving the quality of data sent back to ad platforms, helping AI algorithms identify the right prospects.
04
Creative performance
Improving ad content quality based on actual performance data and replacing subjective judgments with measurable evidence.
05
In-house Martech system
Leveraging PMAX's proprietary data and algorithms (PAXY) to automate real-time tracking and optimization.
From budget management to lead growth
I can help your business make every budget dollar count
Let's build a standardized, funnel-based performance marketing system that optimizes cost per lead and delivers qualified leads to your sales team.






 Tiếng Việt
 English